

Give the Gift of Choice!
Too many options? Treat your friends and family to their favourite stores with a Bayshore Shopping Centre gift card, redeemable at participating retailers throughout the centre. Click below to purchase yours today!Purchase HereHome
Economy of Macedonia
Coles
Loading Inventory...
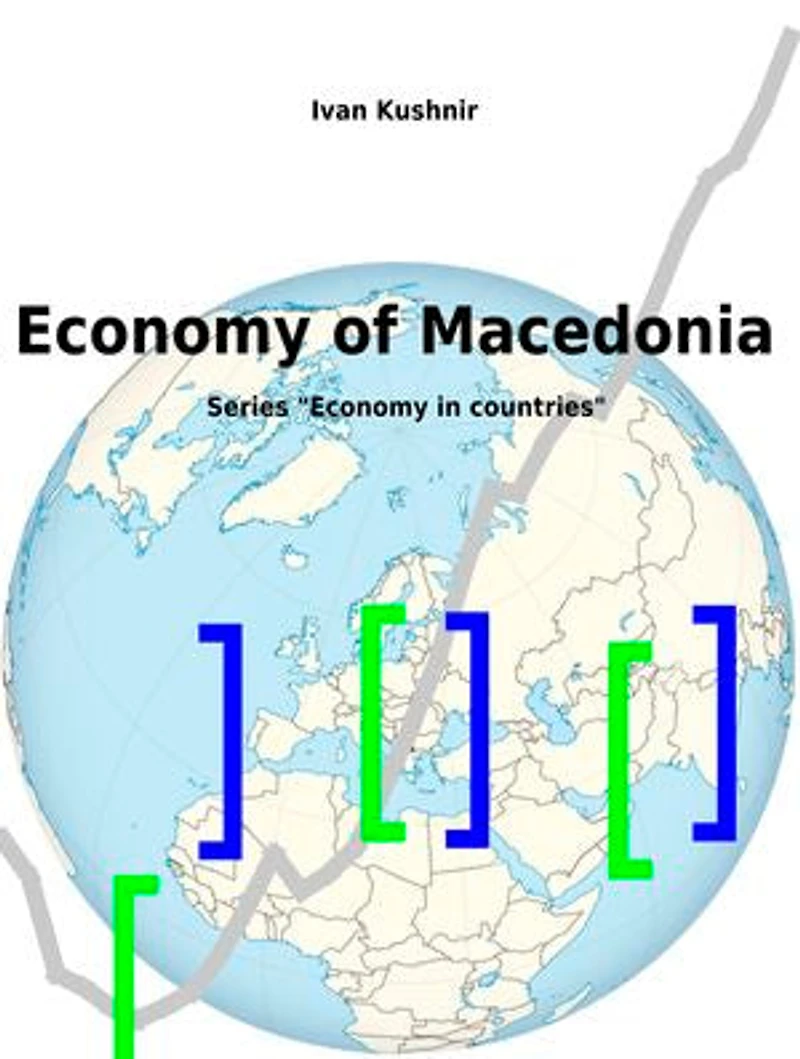
Economy of Macedonia in Ottawa, ON
Current price: $5.42

Economy of Macedonia in Ottawa, ON
Current price: $5.42
Loading Inventory...
Size: Kobo eBook
*Product information may vary - to confirm product availability, pricing, shipping and return information please contact Coles
This book about the economy of Macedonia from the 1990s to the 2010s. Source data from UN Data.
Size. In the 2010s, the gross domestic product of Macedonia was equal to $10.9 billion per year; the value of agriculture was $1.0 billion; the value of industry was $1.8 billion. Since the share in the world is between .01% and .1%, the country is classified as a small economy.
Productivity. In the 2010s, the GDP per capita was $5 254.7, the value of agriculture per capita was $486.1, the value of industry per capita was $881.6. Since the productivity is between the average of below average and the average, the economy is classified as developing.
Growth. In the 2010s, the growth of gross domestic product was 2.6%; the growth of agriculture was -2.0%; the growth of industry was 3.5%.
Structure. In the 2010s, the economy of Macedonia consisted of: services (37.9%), industry (19.3%), trade (16.9%), agriculture (10.7%), transportation (8.1%), and construction (7.1%).
Exports and imports. In the 2010s, the imports were 32.3% higher than the exports, the net imports were equal to 16.3% of the GDP.
Consumption and reproduction. The attitude of reproduction to the consumption is not better than the global average, so the share of GDP in the world will not increase.
This book about the economy of Macedonia from the 1990s to the 2010s. Source data from UN Data.
Size. In the 2010s, the gross domestic product of Macedonia was equal to $10.9 billion per year; the value of agriculture was $1.0 billion; the value of industry was $1.8 billion. Since the share in the world is between .01% and .1%, the country is classified as a small economy.
Productivity. In the 2010s, the GDP per capita was $5 254.7, the value of agriculture per capita was $486.1, the value of industry per capita was $881.6. Since the productivity is between the average of below average and the average, the economy is classified as developing.
Growth. In the 2010s, the growth of gross domestic product was 2.6%; the growth of agriculture was -2.0%; the growth of industry was 3.5%.
Structure. In the 2010s, the economy of Macedonia consisted of: services (37.9%), industry (19.3%), trade (16.9%), agriculture (10.7%), transportation (8.1%), and construction (7.1%).
Exports and imports. In the 2010s, the imports were 32.3% higher than the exports, the net imports were equal to 16.3% of the GDP.
Consumption and reproduction. The attitude of reproduction to the consumption is not better than the global average, so the share of GDP in the world will not increase.
You May Also Like












More About Coles at Bayshore Shopping Centre
Coles is renowned for its outstanding customer service and great selection of books. Along with the vast array of magazines, stationary, audio-books, children's literature, fiction, non-fiction and reference books, you can find accessories to make your reading experience more pleasurable. We can recommend the very best in reading today. We will help you search our titles for exactly what you need, and if we do not have it in stock, we will order it for you.
100 Bayshore Dr, Nepean, ON K2B 8C1, Canada
Find Coles at Bayshore Shopping Centre in Ottawa, ON
Visit Coles at Bayshore Shopping Centre in Ottawa, ON